# SQL can be run over DataFrames that have been registered as a table. pets = spark.sql("SELECT id, name FROM pet")
# The results of SQL queries are Dataframe objects. # rdd returns the content as an :class:`pyspark.RDD` of :class:`Row`. petNames = pets.rdd.map(lambda p: "Name: " + p.name).collect() for name in petNames: print(name)
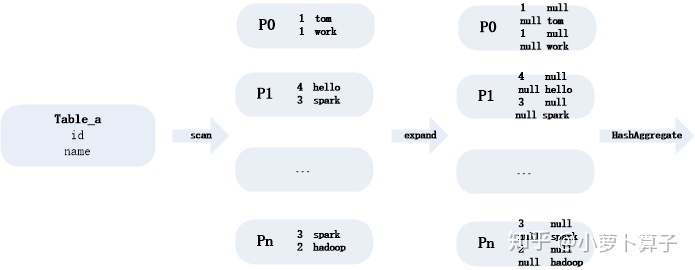
As see from the execution plan, when dealing with count distinct, the Expand method is used.
After expand, use id and name (not id,name) as keys to perform HashAggregate, which is group by, so that it is equivalent to de-duplication. then Calculate count (id) and count (name) directly later, divide and conquer the data. the data skew is alleviated.
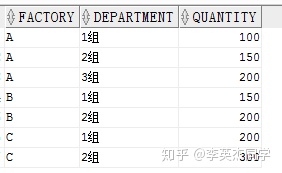
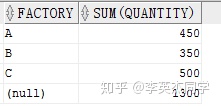
SELECT factory, SUM( quantity ) FROM production GROUPBYROLLUP ( factory ) ORDERBY factory
ROLL UP 搭配 GROUP BY 使用,可以为每一个分组返回一个小计行,为所有分组返回一个总计行
1 2 3 4
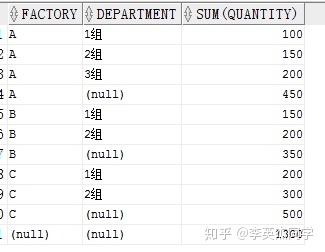
SELECT factory, department, SUM(quantity) FROM production GROUPBYROLLUP(factory, department) ORDERBY factory
如果 ROLLUP(A,B)则先对 A,B进行 GROUP BY,之后对 A 进行 GROUP BY,最后对全表 GROUP BY
如果 ROLLUP(A,B,C)则先对 A,B,C进行 GROUP BY ,然后对 A,B进行GROUP BY,再对 A 进行GROUP BY,最后对全表进行 GROUP BY.
3.2 CUBE
1 2 3 4 5 6
SELECT factory, department, SUM(quantity) FROM production GROUPBYCUBE(factory, department) ORDERBY factory,department;
CUBE(A,B)则先对 A,B 进行 GROUP BY,之后对 A 进行 GROUP BY,然后对 B 进行 GROUP BY,最后对全表进行 GROUP BY
如果 CUBE(A,B,C)则先对 A,B,C 进行 GROUP BY,之后对 A,B ,之后对A,C ,之后对 B,C 之后对 A,之后对 B,之后对 C,最后对全表GROUP BY
3.3 GROUPPING
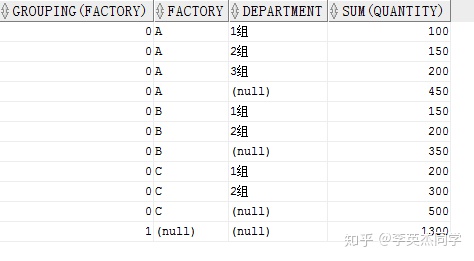
The GROUPING() function can only be used with ROLLUP and CUBE.
GROUPING() receives a column, and returns 0 if this column is not empty, and returns 1 if it is empty.
1 2 3 4 5 6 7 8
SELECT GROUPING(factory), factory, department, SUM(quantity) FROM production GROUPBYROLLUP(factory, department) ORDERBY factory, department;
最后一行的 FACTORY 为空,所以 GROUPING()返回 1.也可以与CUBE结合使用
3.4 GROUPING SETS
1 2 3 4 5 6 7
SELECT factory, department, SUM(quantity) FROM production GROUPBYGROUPING SETS(factory, department) ORDERBY factory, department
GROUPING SETS则对每个参数分别进行分组,GROUPING SETS(A,B)就代表先按照 A 分组,再按照 B分组
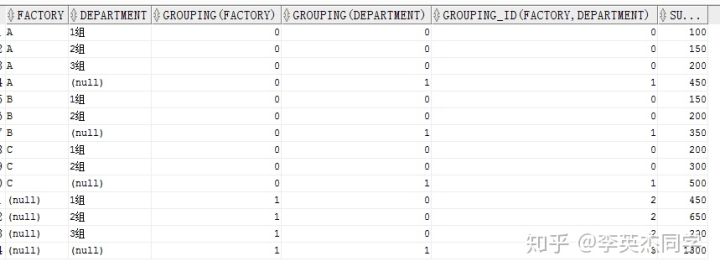
3.5 GROUPING_ID()
1 2 3 4 5 6 7 8 9 10
SELECT factory, department, GROUPING(factory), GROUPING(department), GROUPING_ID(factory,department), SUM(quantity) FROM production GROUPBYCUBE(factory, department) ORDERBY factory, department;
If you select GROUPING_ID=0
With the GROUPING_ID column, we can use the HAVING clause to filter the query results. If you select GROUPING_ID=0, it means that the FACTORY and DEPARTMENT columns are not empty.


Checking if Disqus is accessible...