Data Normalization 可以提升机器学习的成效
Normalization
1
2
3
4
5
6
7
8
9
10
| from sklearn import preprocessing
import numpy as np
a = np.array([[10, 2.7, 3.6],
[-100, 5, -2],
[120, 20, 40]], dtype=np.float64)
print(preprocessing.scale(a))
|
[[ 0.         -0.85170713 -0.55138018]
 [-1.22474487 -0.55187146 -0.852133  ]
 [ 1.22474487  1.40357859  1.40351318]]
Normalization 对结果的影响
1
2
3
4
5
6
7
8
9
10
11
12
13
14
15
|
from sklearn import preprocessing
import numpy as np
from sklearn.model_selection import train_test_split
from sklearn.datasets.samples_generator import make_classification
from sklearn.svm import SVC
import matplotlib.pyplot as plt
|
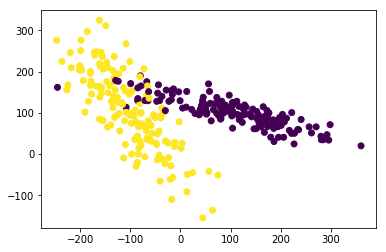
生成适合做 Classification 数据
1
2
3
4
5
6
7
8
9
10
11
12
13
14
15
16
|
X, y = make_classification(
n_samples=300, n_features=2,
n_redundant=0, n_informative=2,
random_state=22, n_clusters_per_class=1,
scale=100)
plt.scatter(X[:, 0], X[:, 1], c=y)
plt.show()
|
data normalization before
1
2
3
4
| X_train, X_test, y_train, y_test = train_test_split(X, y, test_size=0.3)
clf = SVC()
clf.fit(X_train, y_train)
print(clf.score(X_test, y_test))
|
0.477777777778
data normalization after
数据的单位发生了变化, X 数据也被压缩到差不多大小范围.
1
2
3
4
5
6
| X = preprocessing.scale(X)
X_train, X_test, y_train, y_test = train_test_split(X, y, test_size=0.3)
clf = SVC()
clf.fit(X_train, y_train)
print(clf.score(X_test, y_test))
|
0.933333333333
Reference
Checking if Disqus is accessible...